我为什么喜欢 Mathematica
type
status
date
slug
summary
tags
category
icon
password
Property
Jan 3, 2023 05:08 AM
URL
写这篇文章是受人邀请写的,然后自己本科的时候看过一篇文章叫做 我为什么喜欢Mathematica ,受这个文章的启发,我也准备写一个和他一样名字的文章,致谢改文章的作者.
Mathematica 是一个非常好用的数学工具,和 Matlab, maple 并称为世界三大数学软件,只可惜 Mathematica 软件在国内并不受待见,如果你真正用过就会知道它的好! 比 Matlab好用很多!
Mathematica 全程应该是 Wolfram Mathematica,国内都简称为 mma ,实际它是一个编程语言,叫 Wolfram 语言我认为更合适,所以我后文就叫它 Wolfram 语言.
1. 界面介绍
1.1 主页面
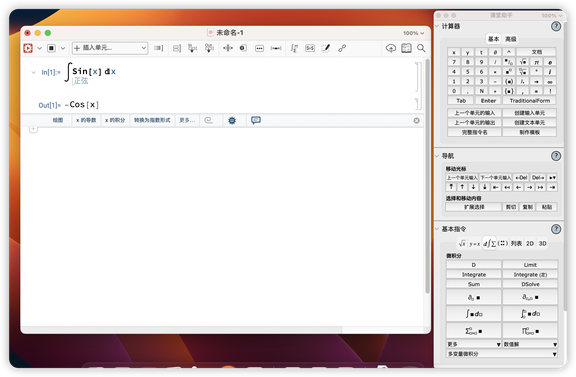
如图所示就是它的界面,非常的简洁有没有!
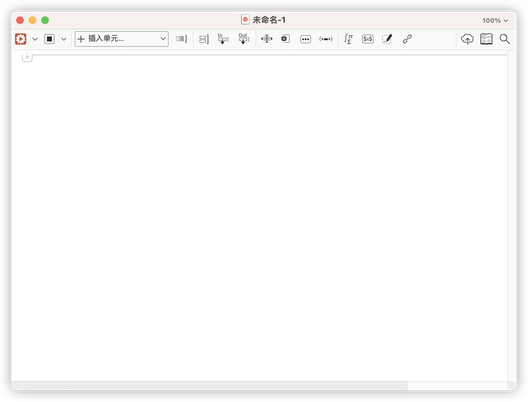
对比一下 Matlab 和 maple 简直就是美到极点!
1.2 排版功能
wolfram 语言内置了各种助手,就算你是啥也不懂的小白,对照这些排版助手,也能整出各种数学公式,可以说 Wolfram 语言就是为了数学而生的
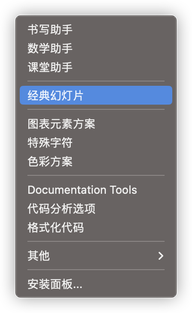
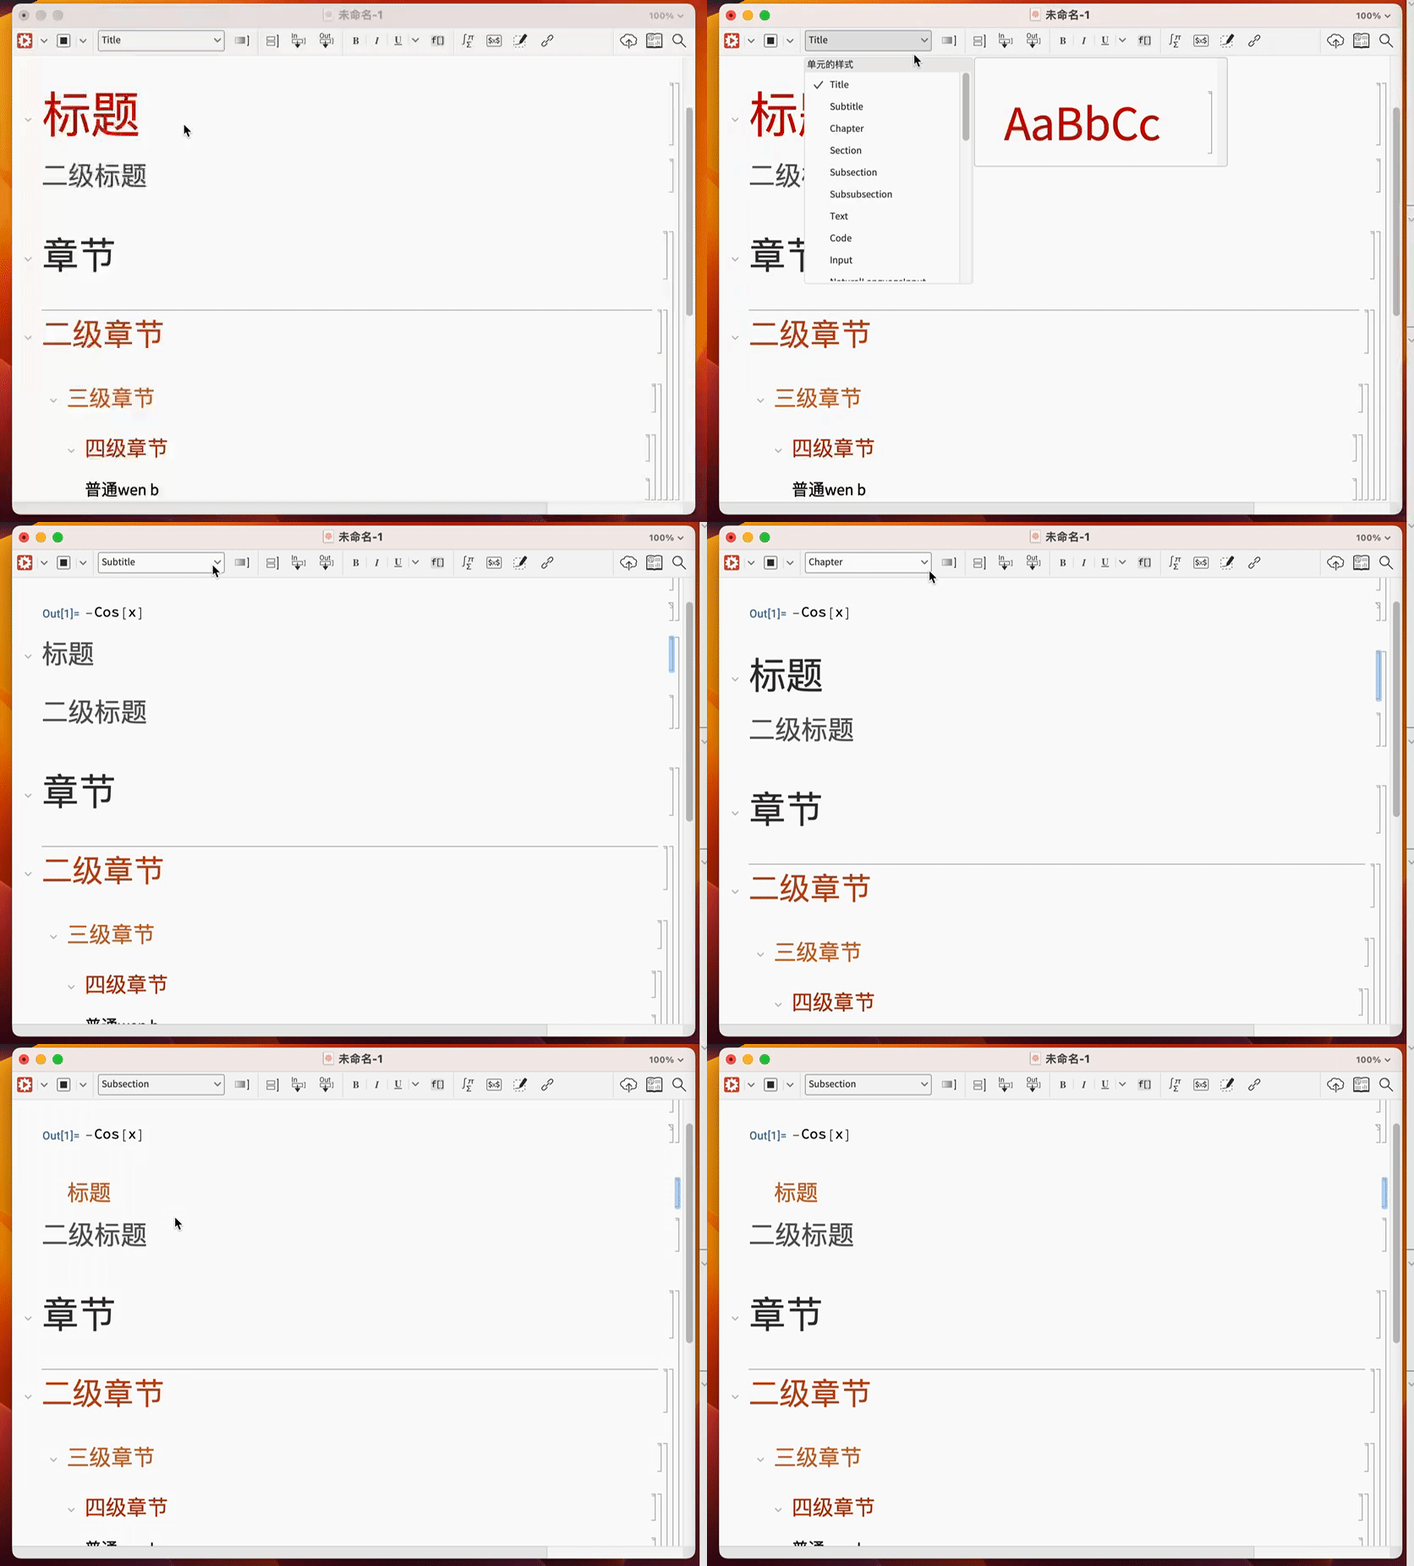
Wolfram 语言中还能设置标题,章节等各种你想要的排版功能.
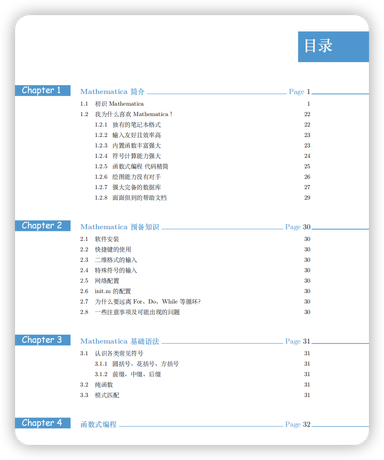
通过调节这些设置,通过熟练掌握,你可以制作出精美的图书:
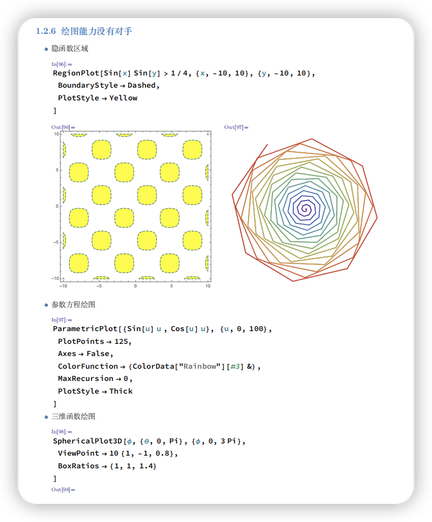
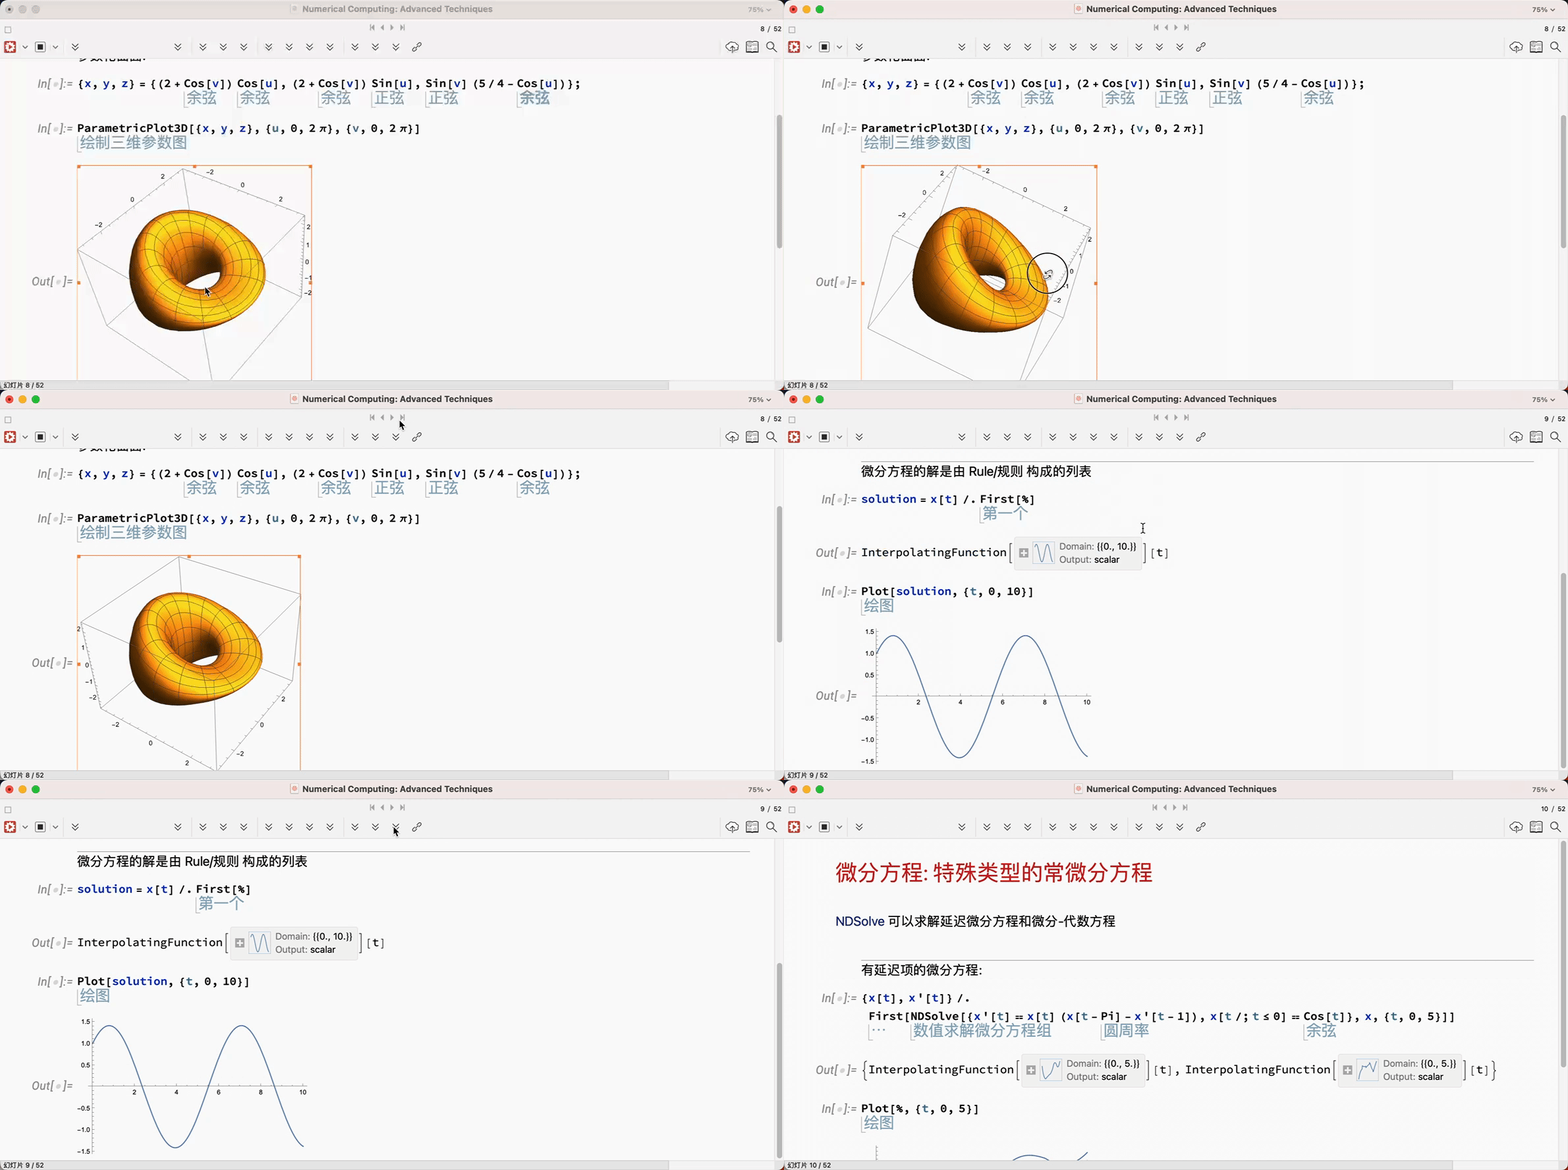
还能制作幻灯片,注意这个是可以动的幻灯片,而且里面的结果都是可以运行的!别人都用 ppt ,你用 Wolfram 语言,是不是逼格很高!
1.3 帮助文档
想一想你学很多编程语言的时候,是不是很多资料都得去百度或者谷歌查?因为大多数编程语言都是外国人开发的,都是英文的文档,像 Matlab,maple 自带的帮助文档就是英文的非常不方便,来看看 Wolfram 语言的!
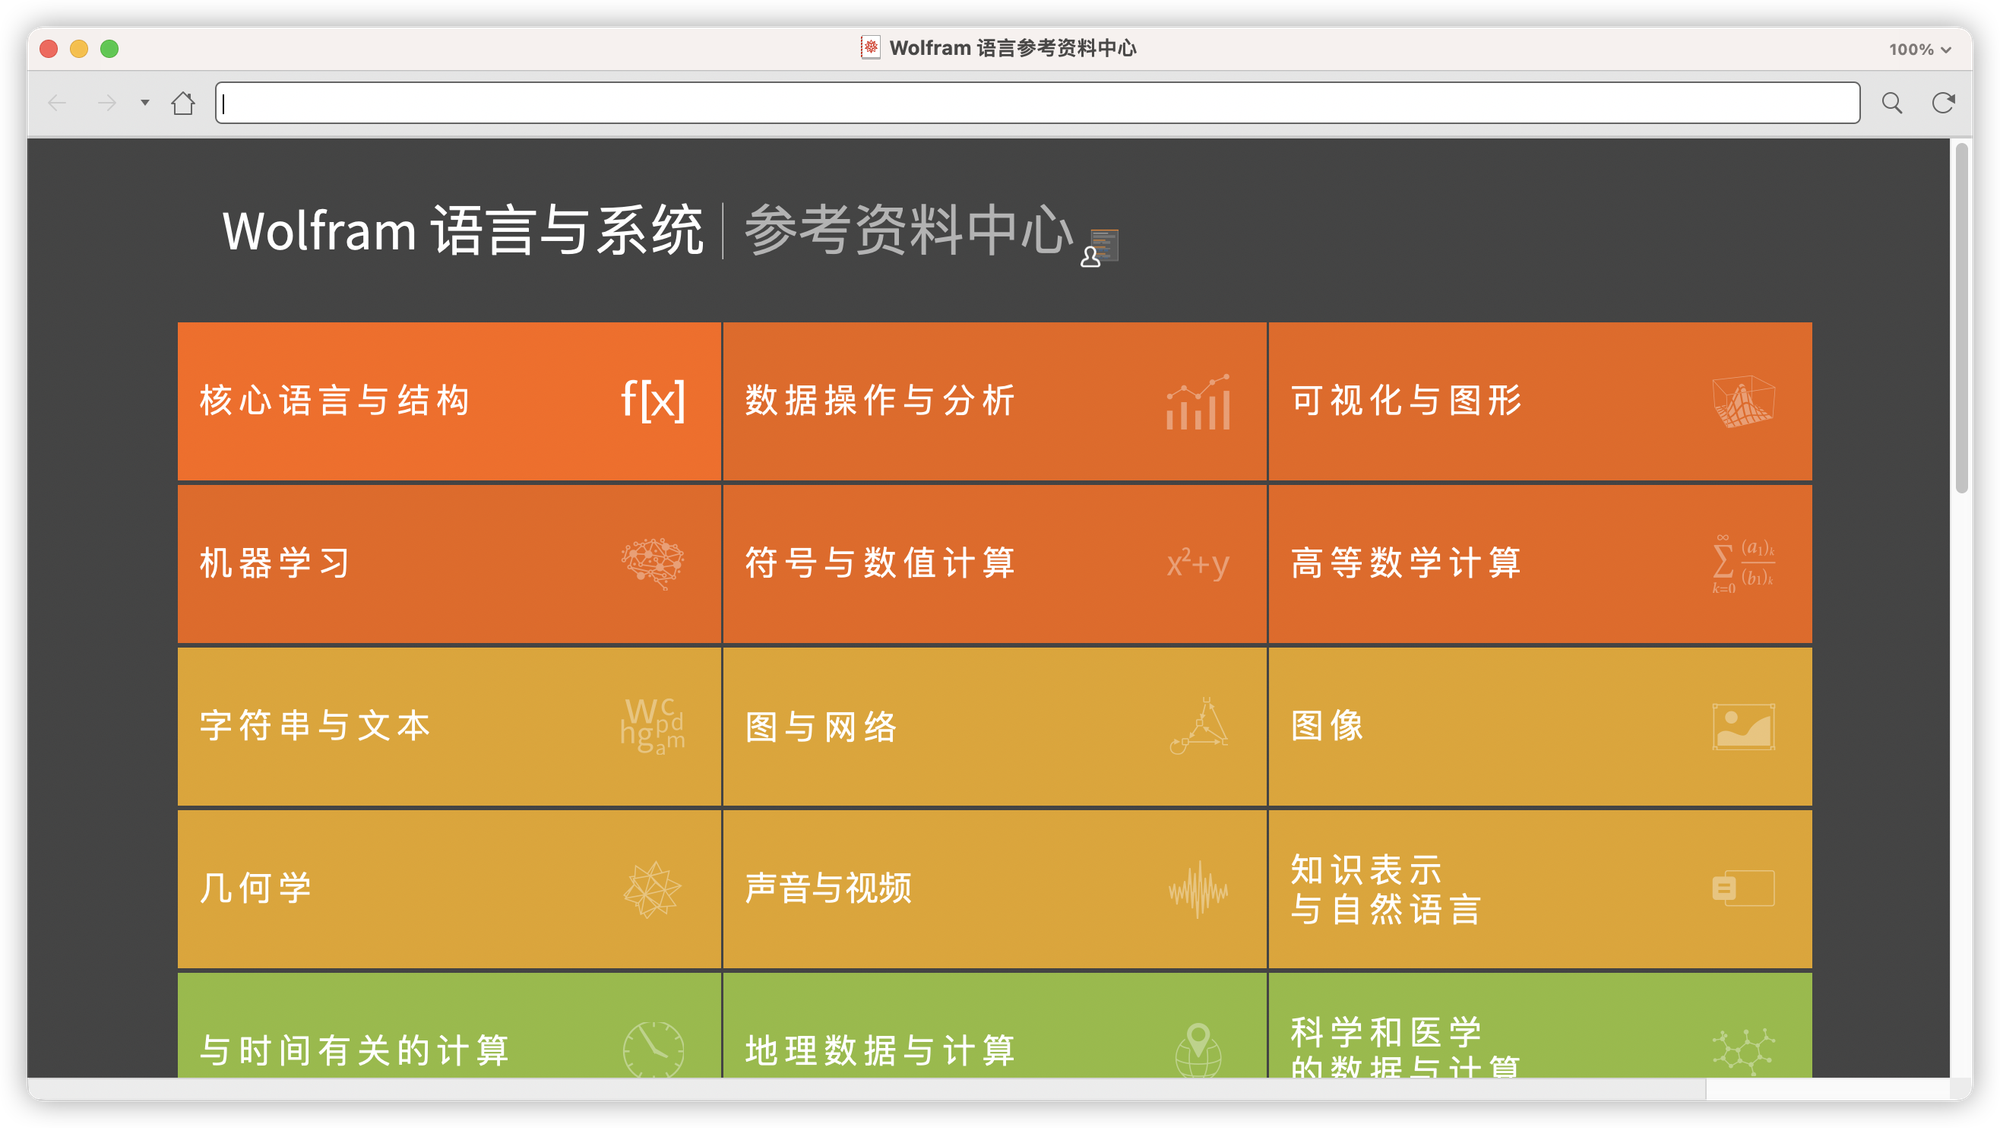
看到没,你想学什么直接去查,而且是中文的,帮助文档都是可以随便运行的,关键是中文!
举例来说你想画图,直接查就行了!各种例子都有,简直就是个百科全书,应有经有!
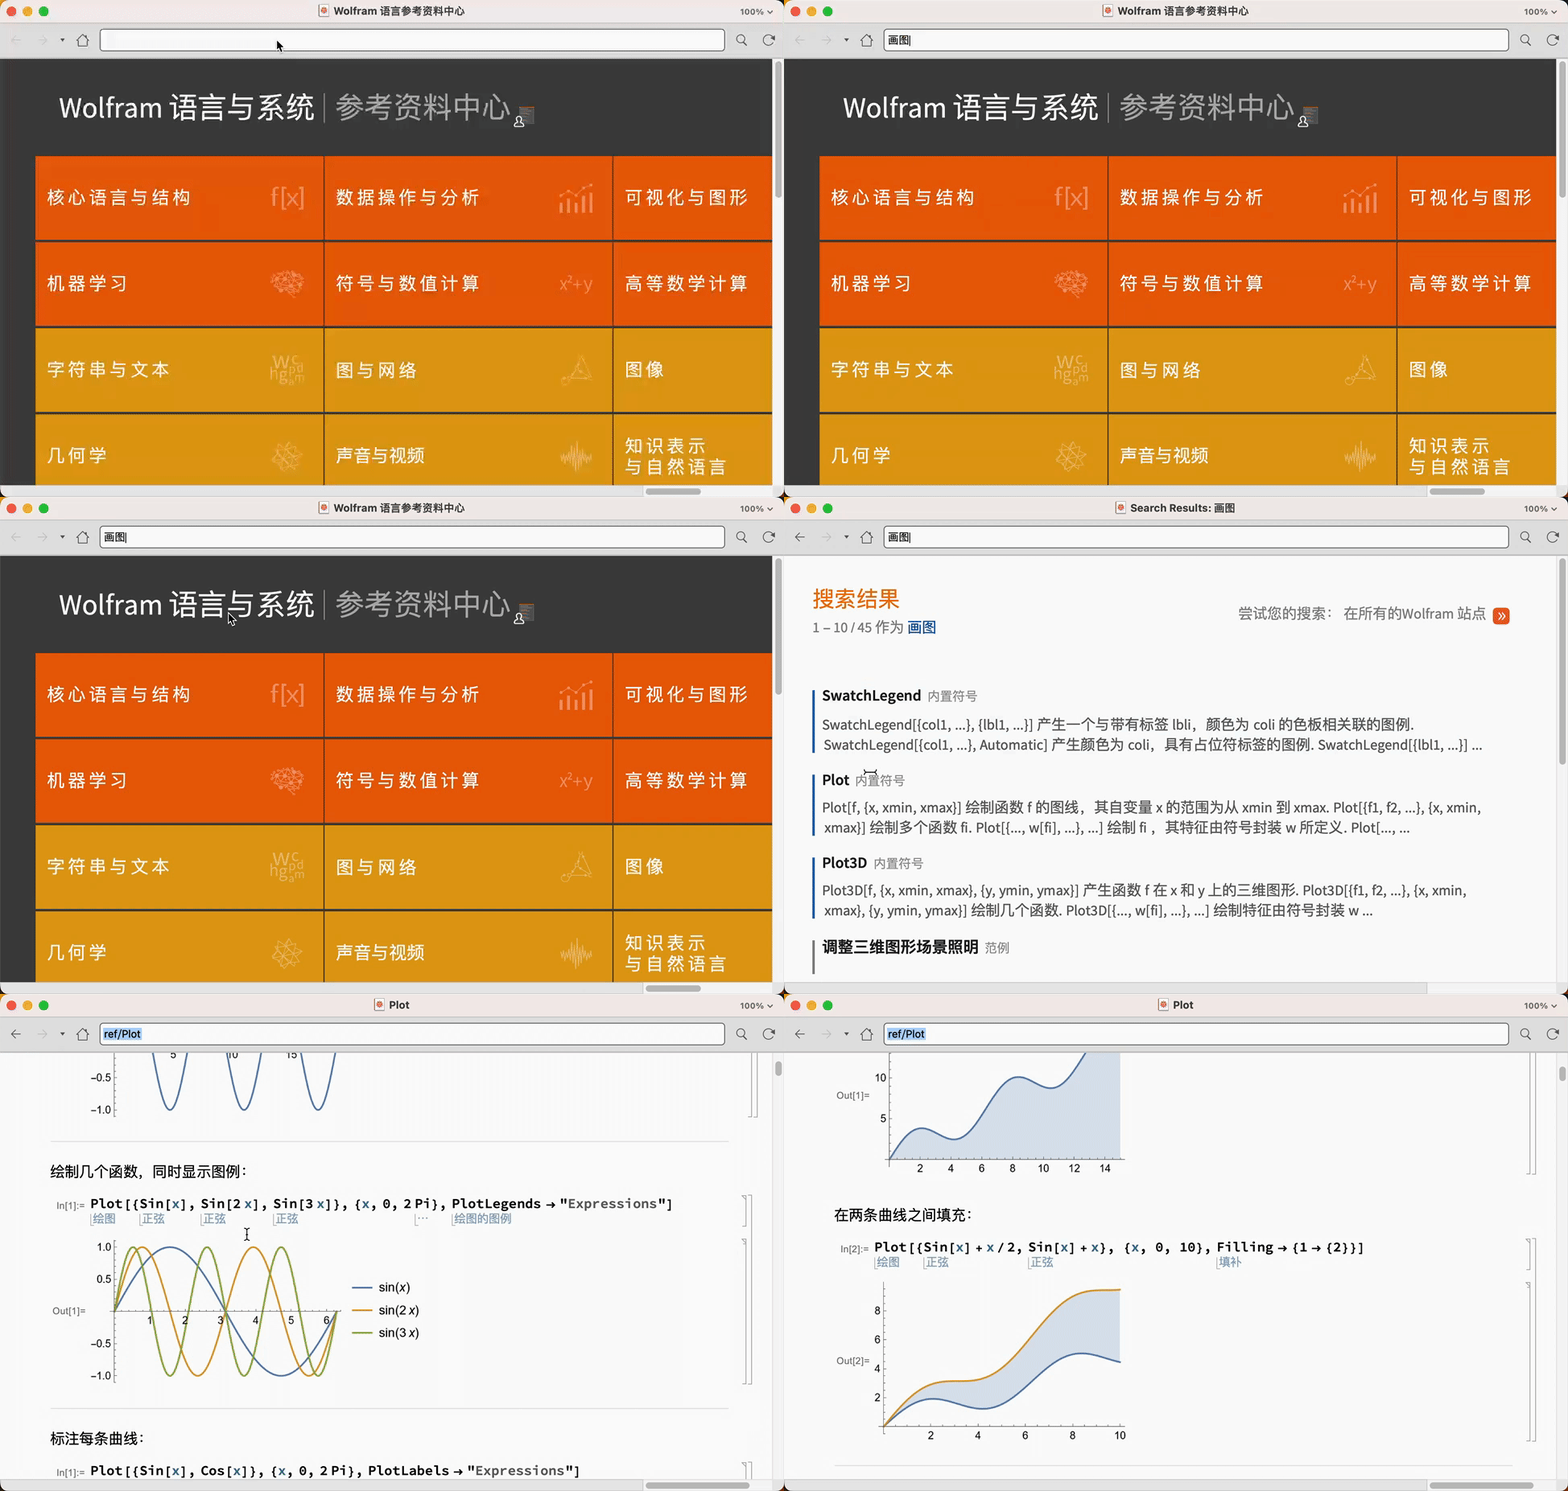
学 Wolfram 语言的人经常讲,帮助文档就是最好的学习资料!
2. 编程能力
说了这么多我们似乎还没进入正题,Wolfram 语言的强大之处还在于它的编程,以及学习的友好度.
2.1 代码提示
代码提示? 有些人可能会感觉好笑,几乎所有的编程语言都有代码提示,但是和 wolfram 语言相比就是弟弟
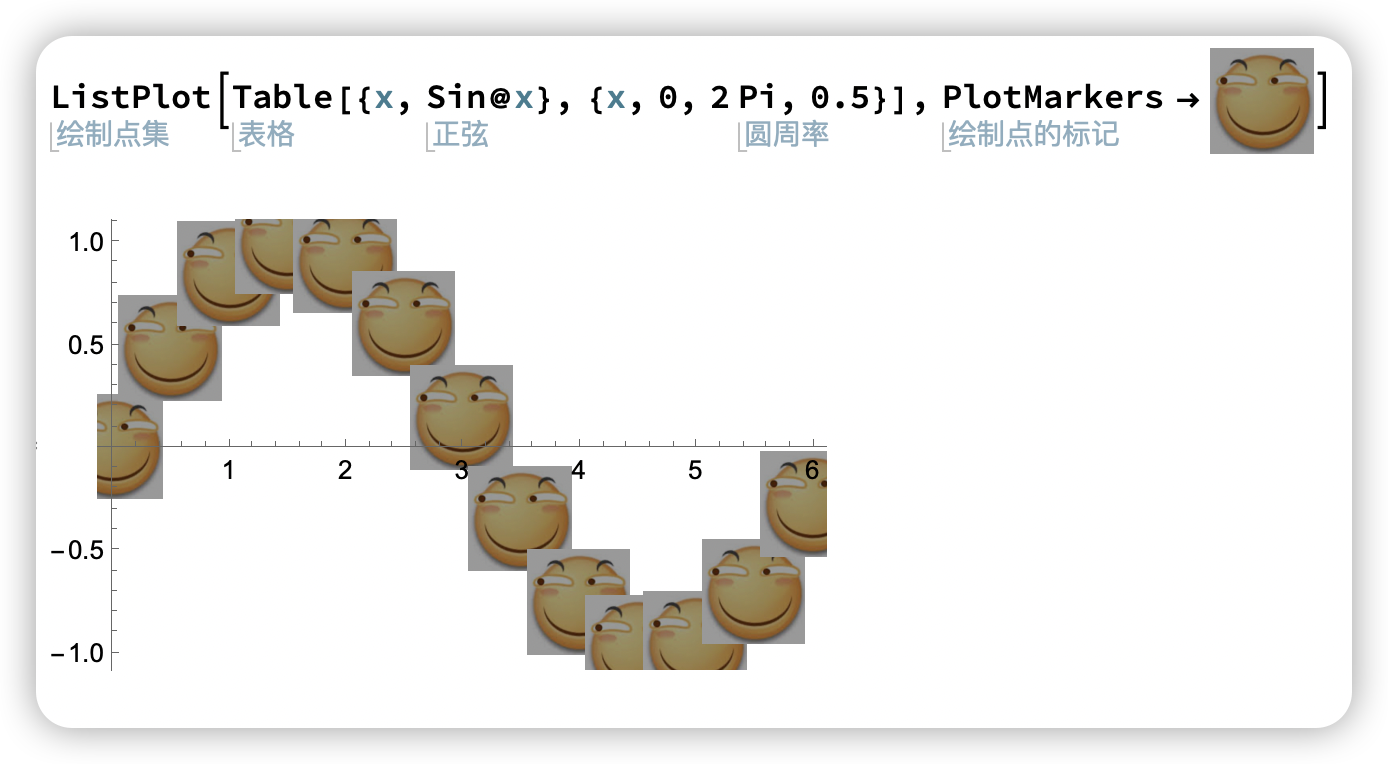
下面的例子中,把关键词 Plot 是绘图, Sin 是正弦, Pi 是圆周率全部告诉你了,你一眼就能看懂
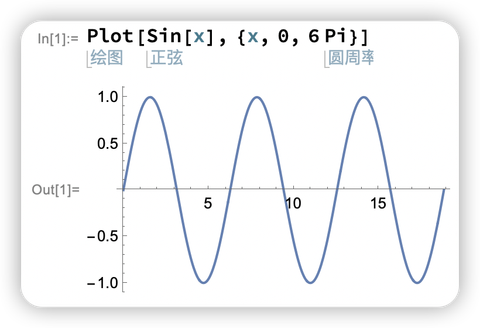
你是不是经常记不住命令?Wolfram 语言来帮助你
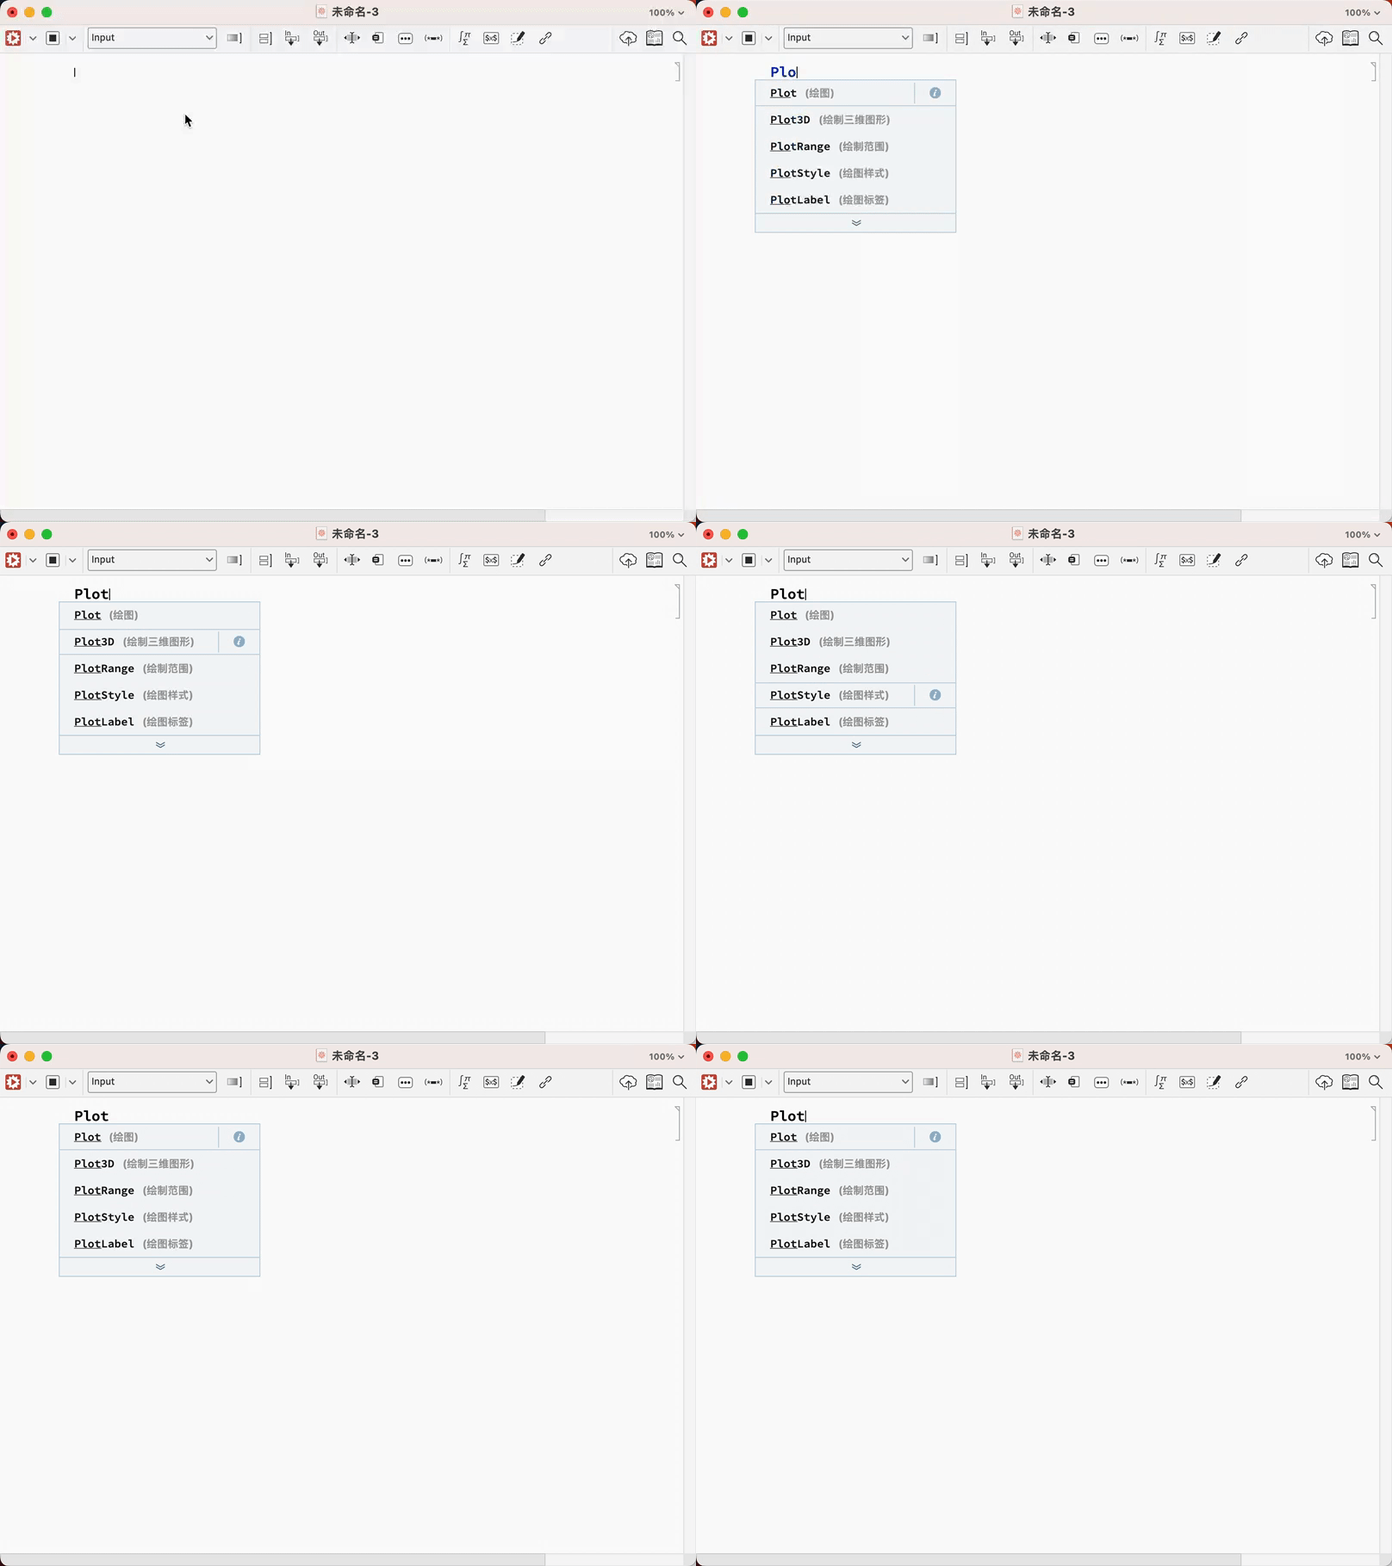
看见了吗?全部都是提示,而且是中文的!我就问牛不牛!
你也许说我命令记不住解决了,我是小白我不知道怎么输入啊,还是可以帮你!
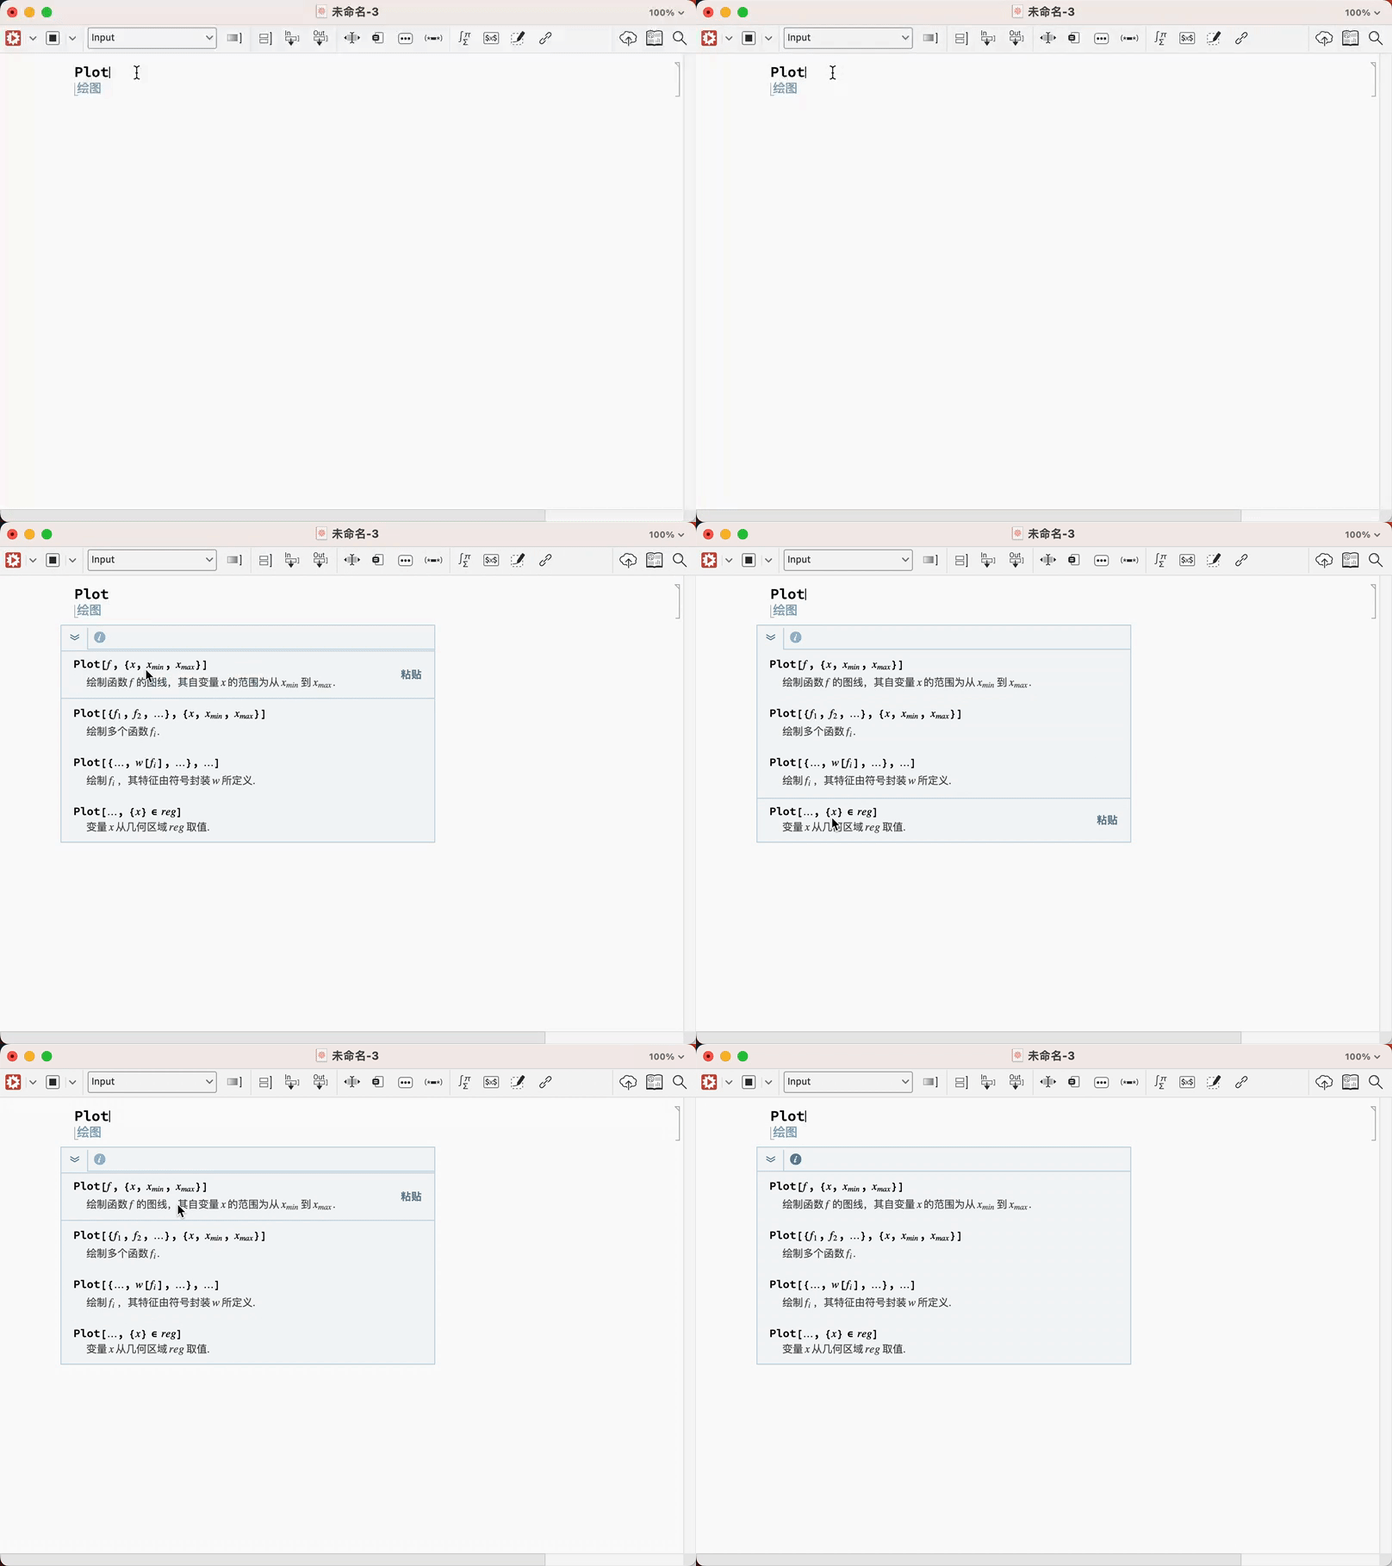
看见了吧,直接告诉你怎么输入,是不是很方便.
2.2 多种输入形式
看见没有下面的一个绘图程序,可以用三种不同的表现形式来展示,非常灵活的输入
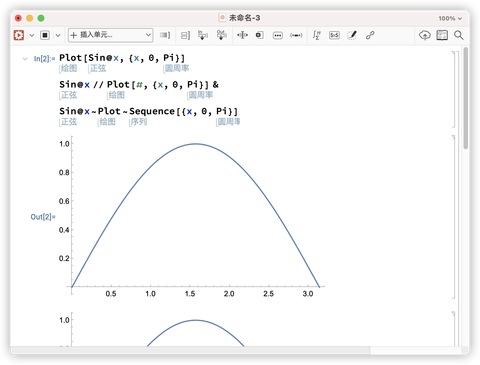
各种函数的简写
你可能看不懂,你只需要知道,通过这些简写的代码,可以将原来几行甚至几十行的代码弄成一行来完成,说到这里就不得不说一下 Wolfram 语言每年举办的 “一行代码” 大赛
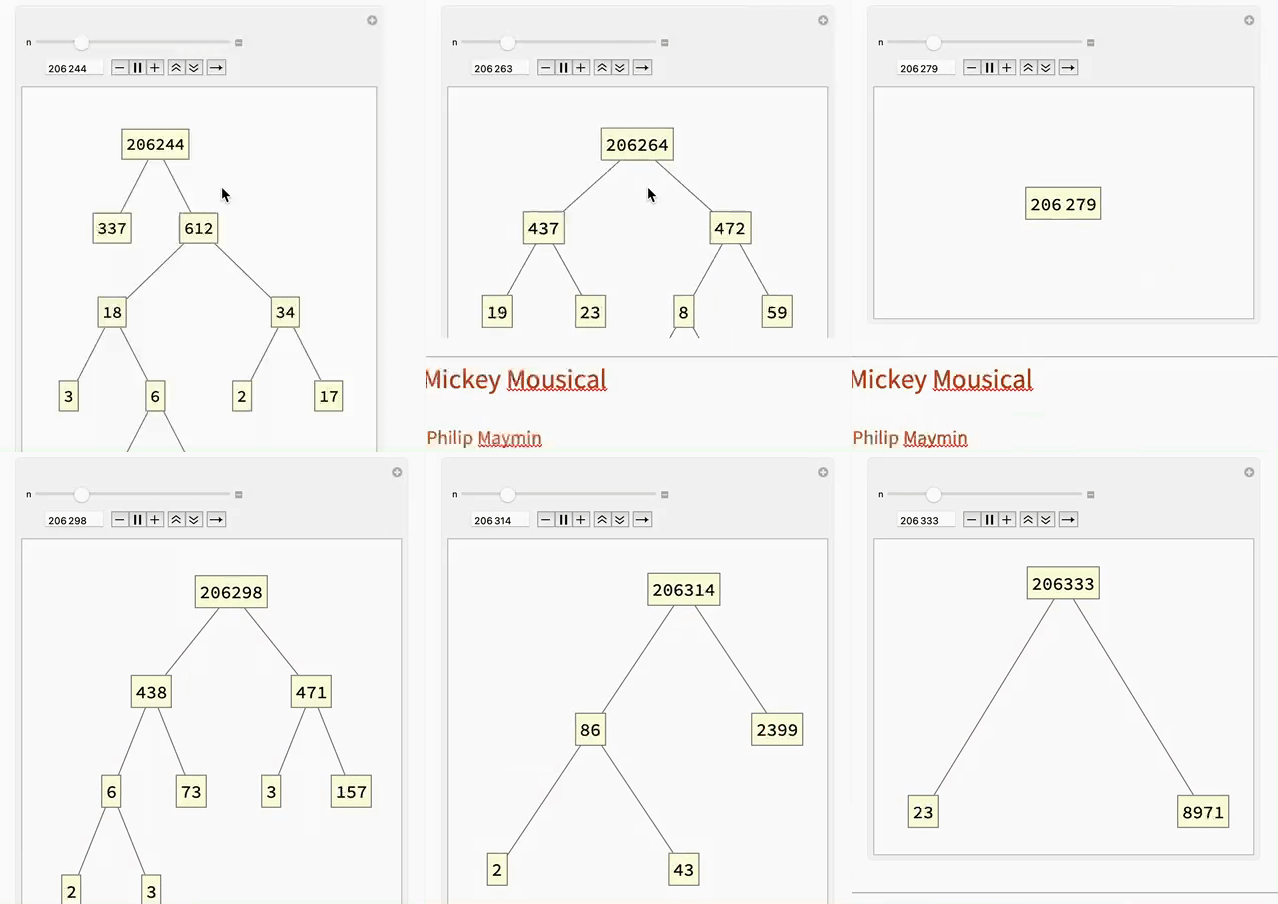
Manipulate[ n //. x_ /; ! PrimeQ@x && x > 1 :> ToString@x @@ (Nearest[Divisors@x, Sqrt@x][[1]]^{1, -1} {1, x}) // TreeForm, {{n, 10^5}, 1, 10^6, 1}]

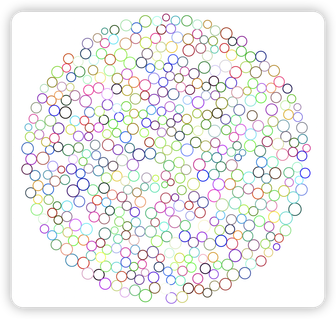
Graphics[{RandomColor[], #} & /@ Insphere /@ Module[{s = DiscretizeRegion@Disk[]}, MeshCoordinates[s][[#]] & /@ #[[1]] & /@ MeshCells[s, 2]]]

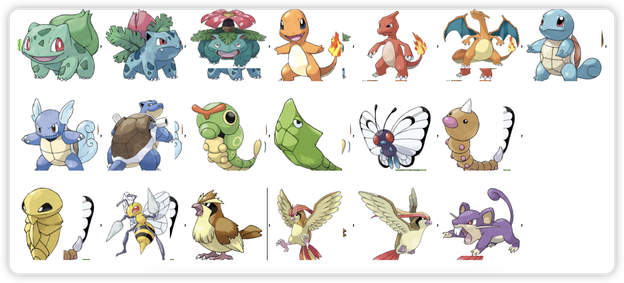
Export["pFirstGen.gif", EntityValue[ EntityList[ EntityClass["Pokemon", "GenerationI"]], "Image"]]; Import["pFirstGen.gif"]

上面这些只是冰山一角.
2.3 一切皆表达式
在 Wolfram 语言中所有的东西就是表达式
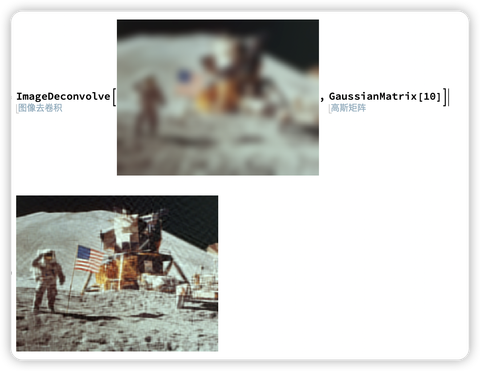
对图片做运算
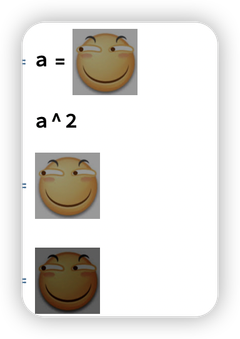
直接将图中的点替换成滑稽图像
去“码”
是不是可以….,你懂的(滑稽)…
2.4 强大的绘图能力
下面展示部分绘图
2.4.1 手绘石墨烯
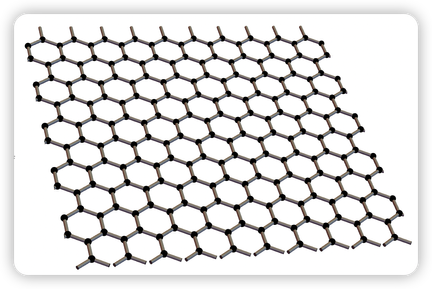
unitCell3D[x_, y_, z_] := { Black, Sphere[{x, y, z}, 0.1], Black, Sphere[{x, y + 2/3 Sin[120 Degree], z}, 0.1], Gray, Cylinder[{{x, y, z}, {x, y + 2/3 Sin[120 Degree], z}}, 0.05], Cylinder[{{x, y, z}, {x + Cos[30 Degree]/2, y - Sin[30 Degree]/2, z}}, 0.05], Cylinder[{{x, y, z}, {x - Cos[30 Degree]/2, y - Sin[30 Degree]/2, z}}, 0.05]} Graphics3D[ Block[{unitVectA = {Cos[120 Degree], Sin[120 Degree], 0}, unitVectB = {1, 0, 0}}, Table[unitCell3D @@ (unitVectA j + unitVectB k), {j, 20}, {k, 20}]], Boxed -> False, PlotRange -> {{0, 10}, {0, 10}, {-1, 1}}]

2.4.2 制作同步时钟
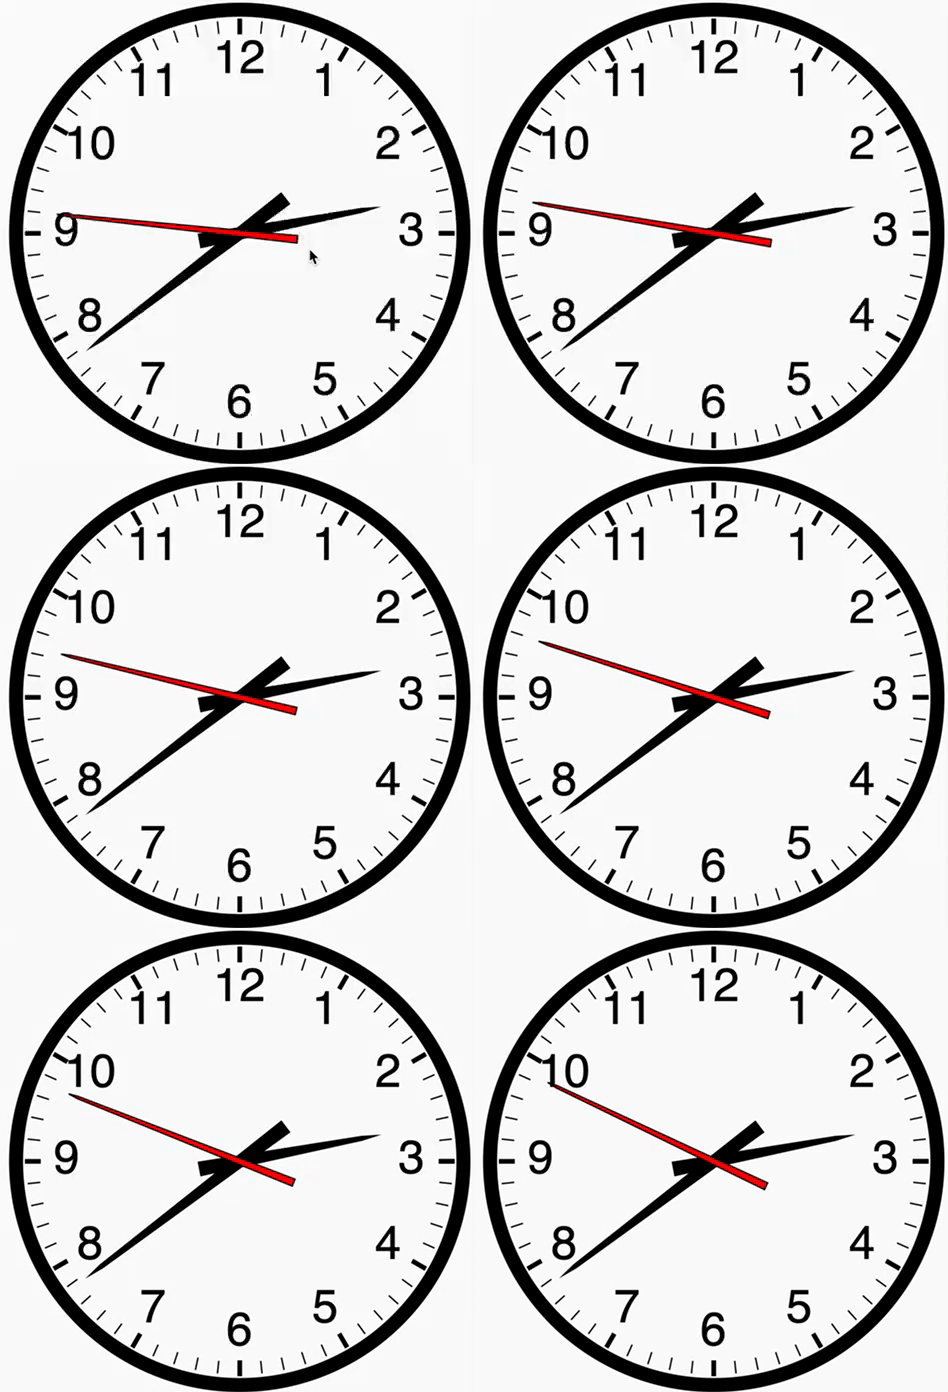
makeHand[fl_, bl_, fw_, bw_] := Polygon[{{-bw, -bl}, {bw, -bl}, {fw, fl}, {0, fl + 8 fw}, {-fw, fl}}/9]; hourHand = makeHand[5, 5/3, .1, .3]; minuteHand = makeHand[7, 7/3, .1, .3]; secondHand = {Red, EdgeForm[Black], makeHand[7, 7/3, .1/2, .3/2]}; Graphics[{{Thickness[.03], Circle[]},(*Rim*){Thickness[.003], Table[Line[{.9 {Cos[a], Sin[a]}, .95 {Cos[a], Sin[a]}}], {a, 0, 2 \[Pi], 2 \[Pi]/60}]},(*Thin ticks*){Thickness[.01], Table[Line[{.9 {Cos[a], Sin[a]}, .95 {Cos[a], Sin[a]}}], {a, 0, 2 \[Pi], 2 \[Pi]/12}]},(*Thick ticks*) Style[Table[ Text[i, .77 {Cos[-i \[Pi]/6 + \[Pi]/2], Sin[-i \[Pi]/6 + \[Pi]/2]}], {i, 1, 12}], FontFamily -> "Helvetica", FontSize -> 36],(*Numbers*) Rotate[hourHand, Dynamic[Refresh[-30 Mod[AbsoluteTime[]/3600, 60] °, UpdateInterval -> 60]], {0, 0}], Rotate[minuteHand, Dynamic[Refresh[-6 Mod[AbsoluteTime[]/60, 60] °, UpdateInterval -> 1]], {0, 0}], Rotate[secondHand, Dynamic[Refresh[-6 Mod[AbsoluteTime[], 60] °, UpdateInterval -> 1/20]], {0, 0}]}]

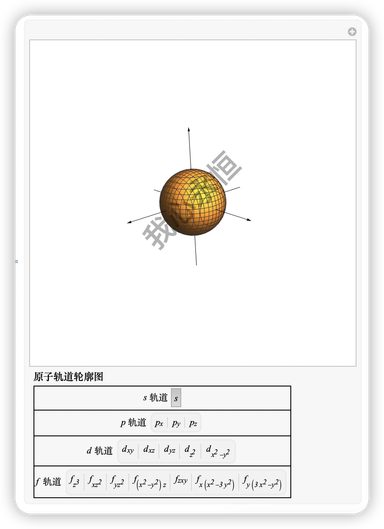
2.4.3 制作原子轨道图
r = Sqrt[x^2 + y^2 + z^2]; (*波函数*)yzl = { ns = 1 Exp[-0.3 r], npx = x Exp[-0.3 r], npy = y Exp[-0.3 r], npz = z Exp[-0.3 r], ndxy = x y/r Exp[-r], ndyz = z y/r Exp[-r], ndxz = x z/r Exp[-r], ndz2 = (3 z^2 - r^2)/r Exp[-r], ndx2y2 = (x^2 - y^2) r Exp[-r], nfz3 = (5 z^3 - 3 z r^2) Exp[-r], nfxz2 = (5 x z^2 - x r^2) Exp[-r], nfyz2 = (5 y z^2 - y r^2) Exp[-r], nf1 = (x^2 - y^2) z Exp[-r], nfxyz = (x y z) Exp[-r], nf2 = (x^3 - 3 x y^2) Exp[-r], nf3 = (3 x^2 y - y^3) Exp[-r]}; (*轨道名称*)gd = {s, Subscript[p, x], Subscript[p, y], Subscript[p, z], Subscript[d, xy], Subscript[d, xz], Subscript[d, yz], Subscript[ d, z^2], Subscript[d, x^2 - y^2], Subscript[f, z^3], Subscript[f, xz^2], Subscript[f, yz^2], Subscript[f, z (x^2 - y^2)], Subscript[ f, zxy], Subscript[f, x (x^2 - 3 y^2)], Subscript[f, y (3 x^2 - y^2)]}; (*水印*)watermark = Style["我心永恒", 36, Bold, FontFamily -> "Helvetica", Opacity[.3]]; (*空间三个坐标轴*) jian = Graphics3D[{{Thin, Black, Arrowheads[.015], Arrow[{{0, -10, 0}, {0, 10, 0}}], Text[y, {0, 10.5, 0}]}, {Thin, Black, Arrowheads[.015], Arrow[{{-10, 0, 0}, {10, 0, 0}}], Text[x, {10.5, 0, 0}]}, {Thin, Black, Arrowheads[.015], Arrow[{{0, 0, -10}, {0, 0, 10}}]}, Text[z, {0, 0, 10.5}]}, Ticks -> False, Axes -> False, AxesOrigin -> {0, 0, 0}, Boxed -> False]; f[x_, y_, z_, fu_] := f[x, y, z, fu] = If[x == 0 && y == 0 && z == 0, None, fu] Manipulate[ Show[ContourPlot3D[fu, {x, -10, 10}, {y, -10, 10}, {z, -10, 10}, Boxed -> False, Axes -> False, Epilog -> Inset[watermark, Automatic, Automatic, Automatic, {1, 1}]], jian, ViewPoint -> {1, 1, 1}], Style["原子轨道轮廓图", Bold, Medium, FontFamily -> "Times New Roman"], Style[Grid[{{Control[{{fu, ns, "s 轨道"}, {ns -> "s"}, ControlType -> SetterBar}]}, {Control[{{fu, npx, "p 轨道"}, Thread[yzl -> gd /. {{x_} -> "x"}][[2 ;; 4]], ControlType -> SetterBar}]}, {Control[{{fu, ndxy, "d 轨道"}, Thread[yzl -> gd /. {{x_} -> "x"}][[5 ;; 9]], ControlType -> SetterBar}]}, {Control[{{fu, nf, "f 轨道"}, Thread[yzl -> gd /. {{x_} -> "x"}][[10 ;; 16]], ControlType -> SetterBar}]}}, Frame -> {False, All}], FontSlant -> Italic, FontFamily -> "Times New Roman", FontSize -> 11], ControlPlacement -> Bottom ]

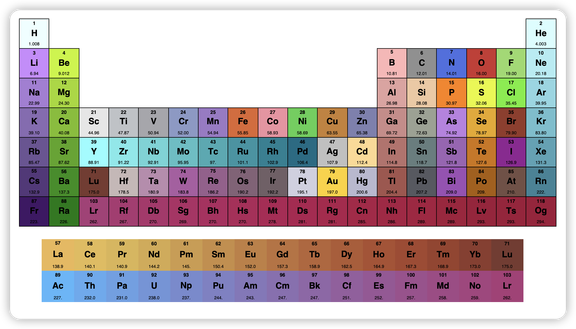
2.4.4 手绘元素周期表
makeElemDetail[a_] := Module[{abr, name, atomicWeight, density, melting, boiling, color, phase}, {abr, name, atomicWeight, density, melting, boiling, color, phase} = Table[ElementData[a, p], {p, {"Abbreviation", "StandardName", "AtomicMass", "Density", "MeltingPoint", "BoilingPoint", "Color", "Phase"}}]; Grid[{{name, SpanFromLeft, a}, {abr, atomicWeight, "amu"}, {"Density", density, "Kg/\!\(\*SuperscriptBox[\(m\), \(3\)]\)"}, {"Melting Pt", melting, "C"}, {"Boiling Pt.", boiling, "C"}, {"Phase", color, phase}}, Frame -> All, Alignment -> {{Left, Right, Right}, {Center, Center, Center}}]] makeElem[a_, size_] := Module[{abr, name, atomicWeight}, abr = ElementData[a, "Abbreviation"]; atomicWeight = N[ElementData[a, "AtomicMass"][[1]], 4]; Graphics[{Text[ Style[ToString[a], 9, Bold, FontFamily -> "Helvetica", TextAlignment -> Center], {0, 20}], Text[Style[abr, 16, FontWeight -> "Bold", FontFamily -> "Helvetica"], {0, 0}], Text[Style[ToString[atomicWeight], 8, FontFamily -> "Helvetica", TextAlignment -> Center], {0, -20}]}, ImageSize -> {size, size}]] makePeriodicTable[w_, h_] := Module[{elemData, frame, background, re1 = 57, re2 = 71, re3 = 89, re4 = 103, gsz = 42}, elemData = Table[ElementData[e, p], {e, 1, 118}, {p, {"AtomicNumber", "Period", "Group"}}]; frame = {None, None, Cases[elemData, {a_Integer, p_, g_Integer} :> ({p, g} -> True)]}; background = {None, None, Cases[elemData, {a_Integer, p_, g_Integer} :> ({p, g} -> ElementData[a, "IconColor"])]}; GraphicsColumn[{GraphicsGrid[ Normal[SparseArray[ Cases[elemData, {a_Integer, p_, g_Integer} :> ({p, g} -> a)]]] /. {a_Integer /; a > 0 :> Tooltip[makeElem[a, gsz], makeElemDetail[a]], 0 -> Graphics[{}]}, Frame -> frame, Background -> background, ImageSize -> {w, h}], GraphicsGrid[{Table[ Tooltip[makeElem[a, gsz], makeElemDetail[a]], {a, re1, re2}], Table[makeElem[a, gsz], {a, re3, re4}]}, ImageSize -> {w - 100, 140}, Background -> {None, None, Flatten[Table[{{1, a - re1 + 1} -> ElementData[a, "IconColor"], {2, a - re1 + 1} -> ElementData[a + re3 - re1, "IconColor"]}, {a, re1, re2}]]}]}, Alignment -> {Center, Center}]] makePeriodicTable[1000, 400]

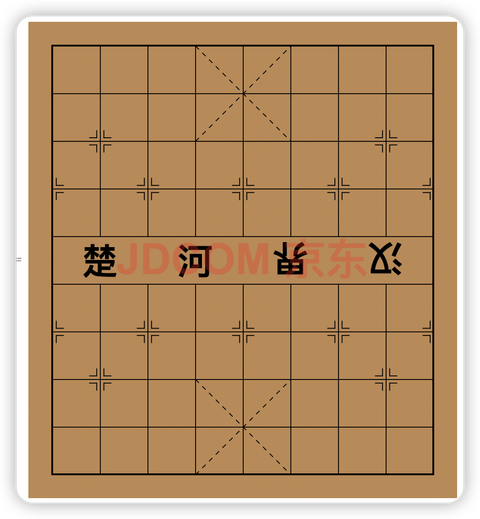
2.4.5 制作象棋棋盘
(* 水印 *) watermark = Style["JDCOM 京东", 36, Red, Bold, Opacity[.3]]; (* 直角槽部分 *) 直角槽[{x_, y_}, s_, l_] := Table[Rotate[ Line[#] & /@ {{{x + s, y + s}, {x + s + l, y + s}}, {{x + s, y + s}, {x + s, y + s + l}}}, \[Pi]/2 i, {x, y}], {i, 4}]; xq = Graphics[ { (* broad frame *) EdgeForm[Thickness[.004]], RGBColor["#bf8850"], Rectangle[{1, 1}, {9, 10}], (* 格子 *) Black, Thickness[.002], Line[#] & /@ Table[{{1, i}, {9, i}}, {i, 10}], Line@Table[{{i, 1}, {i, 5}}, {i, 9}], Line@Table[{{i, 6}, {i, 10}}, {i, 9}], (* 对角线 *) {Dashed, Line@{{{4, 1}, {6, 3}}, {{4, 3}, {6, 1}}, {{4, 10}, {6, 8}}, {{4, 8}, {6, 10}}}}, (* 直角槽 *) 直角槽[#, .075, .15] & /@ Flatten[Join[Table[{i, j}, {i, 1, 9, 2}, {j, 4, 7, 3}], Table[{i, j}, {i, 2, 8, 6}, {j, 3, 8, 5}]], 1], (* 楚河汉界 *) MapIndexed[ Rotate[Text[ Style[#1, 30, Bold, FontFamily -> "KaiTi"], {2 First[#2], 5.5}], If[First[#2] > 2, 1, 0]* \[Pi], {2 First[#2], 5.5}] &, {"楚", "河", "界", "汉"}], EdgeForm[None], RGBColor["#bf8850"], Rectangle[{0, 1}, {0.95, 10}], Rectangle[{9.05, 1}, {10, 10}] }, (* 水印 *) Epilog -> Inset[watermark], Background -> RGBColor["#bf8850"], PlotRange -> {{.5, 9.5}, {.5, 10.5}}, Frame -> False, ImageSize -> 40 {9, 10}]

3. 小结
上面说的只是部分,连 Wolfram 语言 1% 的功能都没说到,模式匹配,规则替换,纯函数等各种牛逼的功能这里都没说,只是多举例图像的例子,会有个更加直观的理解.